Contents
Abstract
As robots tackle increasingly complex tasks, the need for explanations becomes essential for gaining trust and acceptance. Explainable robotic systems should not only elucidate failures when they occur but also predict and preemptively explain potential issues. This paper compares explanations from Reactive Systems, which detect and explain failures after they occur, to Proactive Systems, which predict and explain issues in advance. Our study reveals that the Proactive System fosters higher perceived intelligence and trust and its explanations were rated more understandable and timely. Our findings aim to advance the design of effective robot explanation systems, allowing people to diagnose and provide assistance for problems that may prevent a robot from finishing its task.
CCS Concepts
- Human-centered computing → Empirical studies in interaction design
- Computer systems organization → Robotics
Keywords
Behavior explanation; behavior trees; assumption checkers; robot explanation generation; robot transparency
ACM Reference Format:
Gregory LeMasurier, Alvika Gautam, Zhao Han, Jacob W. Crandall, and Holly A. Yanco. 2024. Reactive or Proactive? How Robots Should Explain Failures. In Proceedings of the 2024 ACM/IEEE International Conference on Human-Robot Interaction (HRI ’24), March 11–14, 2024, Boulder, CO, USA. ACM, New York, NY, USA, 26 pages. https://doi.org/10.1145/3610977.363496
Permission to make digital or hard copies of all or part of this work for personal or classroom use is granted without fee provided that copies are not made or distributed for profit or commercial advantage and that copies bear this notice and the full citation on the first page. Copyrights for components of this work owned by others than the author(s) must be honored. Abstracting with credit is permitted. To copy otherwise, or republish, to post on servers or to redistribute to lists, requires prior specific permission and/or a fee. Request permissions from permissions@acm.org.
HRI ’24, March 11–14, 2024, Boulder, CO, USA
© 2024 Copyright held by the owner/author(s). Publication rights licensed to ACM.
ACM ISBN 979-8-4007-0322-5/24/03…$15.00
https://doi.org/10.1145/3610977.3634963
1 Introduction
As technological advances continue to drive increased autonomy and performance of robot systems in complex tasks, the need to provide coherent explanations becomes imperative. This requirement is particularly critical in shared human-robot workspaces, such as warehouses and manufacturing facilities, where robots are expected to collaborate seamlessly with human counterparts to enhance task efficiency. In such scenarios, robots must possess the capability to explain their behavior to human coworkers, be it in response to system failures or unexpected environmental observations.
The Explainable AI community has made great strides towards explainable systems [2, 5, 10, 15, 16, 32]. Explainable systems can use multiple modalities, including visual (e.g., graphics, images, and plots) [5, 26, 43], motion [26, 27], and natural language (e.g., rules and numeric responses) [5, 26, 43]. In this work, we investigate language-based explanations, with the goal of identifying ways to improve them. As this field develops and grows, it is important to consider how systems should present information, such as cause of failure, to people. For example, systems that explain their failures have improved trust [17, 18, 27, 44, 45], transparency [44], understandability [11, 40, 41, 44] and team performance [44].
Explanations must adapt to recipients’ roles and experience [38] and provide sufficient (but not overwhelming) detail for non-experts to understand and act upon [25], to facilitate prompt assistance for addressing anomalies that the robot may not autonomously rectify, to improve human-robot collaboration. Various studies [11, 40, 41] have explored different explanation structures in human-robot interaction. For instance, causal explanations that combine an action with a reason enhance understandability and desirability [40]. Context-rich explanations, including action history, enable non-experts to detect and solve errors encountered by a robot [11]. Including the reason for failure in an explanation improves both understandability and helpfulness [41]. These investigations [11, 40, 41] focus on explanations generated by Reactive Systems [11–13, 22, 24, 30, 44], which respond to and detect failures after they occur. Although essential for unforeseeable failures, many failures can be predicted, prevented, or at least seen as possible.
In contrast, Proactive Systems detect, handle, and explain errors earlier, potentially enhancing robot safety and efficiency compared to Reactive Systems. While some Proactive Systems identify tasks outside a robot’s capability [4, 36] or explain robot behaviors [50], our focus is on Proactive Systems that are capable of identifying failures during task execution (e.g., [3, 14]). When a Proactive System determines that a failure will occur, it can use the information that identified the expected failure in its explanation.
While most user studies have focused on Reactive Systems for robot failure explanations [11, 40, 41], the timing of error detection in Proactive Systems along with the depth of information available can potentially result in better human-robot interactions.
We use a Behavior Tree representation for the Reactive system. To facilitate the transition from a Reactive to a Proactive system, we identify assumptions regarding system capabilities and expected environmental conditions critical for task completion.
Our work contributes to the existing literature by conducting a user study to evaluate both Reactive and Proactive error detection systems. Our analysis shows the efficacy of tracking the status of assumptions to proactively generate robot failure explanations. Further, our analysis also offers insights on people’s perception of the different systems, the understandability of the explanations, and their perception of the timing of each system’s explanations.
2 System Design
2.1 Reactive System using Behavior Trees
Behavior Trees offer a robust framework for robot systems to generate automated explanations [24]. A Behavior Tree (BT) [7] itself is a task sequence and execution method that can be used to represent a robot’s internal states and actions for the execution of robot tasks. Han et al [24] proposed using behavior trees to generate robot explanations. In their work, free-form BTs were framed into semantic sets: {goal, subgoals, steps, actions} to create shallow hierarchical explanations and answer follow-up questions when users ask for details, an explanation method preferred by users [25]. While many BT implementations, including ours, are hand-crafted, there are also generative implementations that learn a BT [8, 48, 49]. Behavior Trees alone form a Reactive System capable of reacting to failures by explaining them only after they occur. While the solution proposed by Han et al [24] was capable of explaining what action the robot failed to accomplish, the system did not have enough information to provide explanations as to why it failed.
Failure of an action can occur due to a number of factors; thus, understanding why a robot failed is necessary so that human users can provide required assistance in a timely manner. Consider a scenario where a human coworker is tasked with supplying the robot with screws by refilling the screw container as needed. In this case, the robot’s failure to pick up a screw can potentially happen due to (1) a screw being too far from the robot’s arm, or (2) the robot being unable to see the screw. Depending on the cause of failure, the nature of assistance required will be different for the same failed action (moving the screw container to a reachable location vs. making sure the robot’s view is not blocked). Thus, it is easier for the human to assist the robot if it knows why the robot failed. In contrast, if the cause of failure is not known, the human might end up providing incorrect assistance, resulting in more failures, higher task completion time, and poor team performance.
The underlying causes of task failures often include two key factors: (1) system capabilities and (2) environmental conditions [6, 21]. While robot systems may not consistently foresee system glitches and environmental anomalies, they frequently establish assumptions concerning their capabilities and anticipated environmental states. These sets of assumptions and biases, whether deliberate or inadvertent, intricately embed themselves within a robot’s decision-making algorithms, thus dictating its performance [20].
Returning to the screw scenario, the robot’s motion planner, which calculates a path to approach and grasp the screw, depends on an assumption that the screw’s location, as determined by the vision system, remains accurate. Alignment between these assumptions and the actual system and environment state results in predictable behavior, leading to higher performance. Deviations from these assumptions lead to unpredictable behavior of robot actions on the environment, culminating in failures and diminished performance.
2.2 Proactive System via Assumption Checkers
Communicating the cause(s) of predicted task failures is an important aspect of explaining a robot’s behavior. As described above, tracking and communicating any assumption violations in the algorithm inputs (i.e., expected system and environment state) and their expected outputs gives insight into the robot’s awareness of its limits for completing a task successfully. Additionally, these assumptions can be used to estimate system performance [6, 21] and take corrective actions [51], allowing a robot to identify and respond to errors earlier, resulting in a Proactive System.
In this work, we identify various task-related assumptions and encode them into BT representations of a robot’s tasks. We leverage the status of these assumptions to predict and track failures and generate explanations. To track the status of the above-mentioned assumptions, we implement monitors and encode them as a part of the behavior tree. We refer to these monitors as Assumption Checkers (ACs), which are used to continuously track whether assumptions hold during task execution.
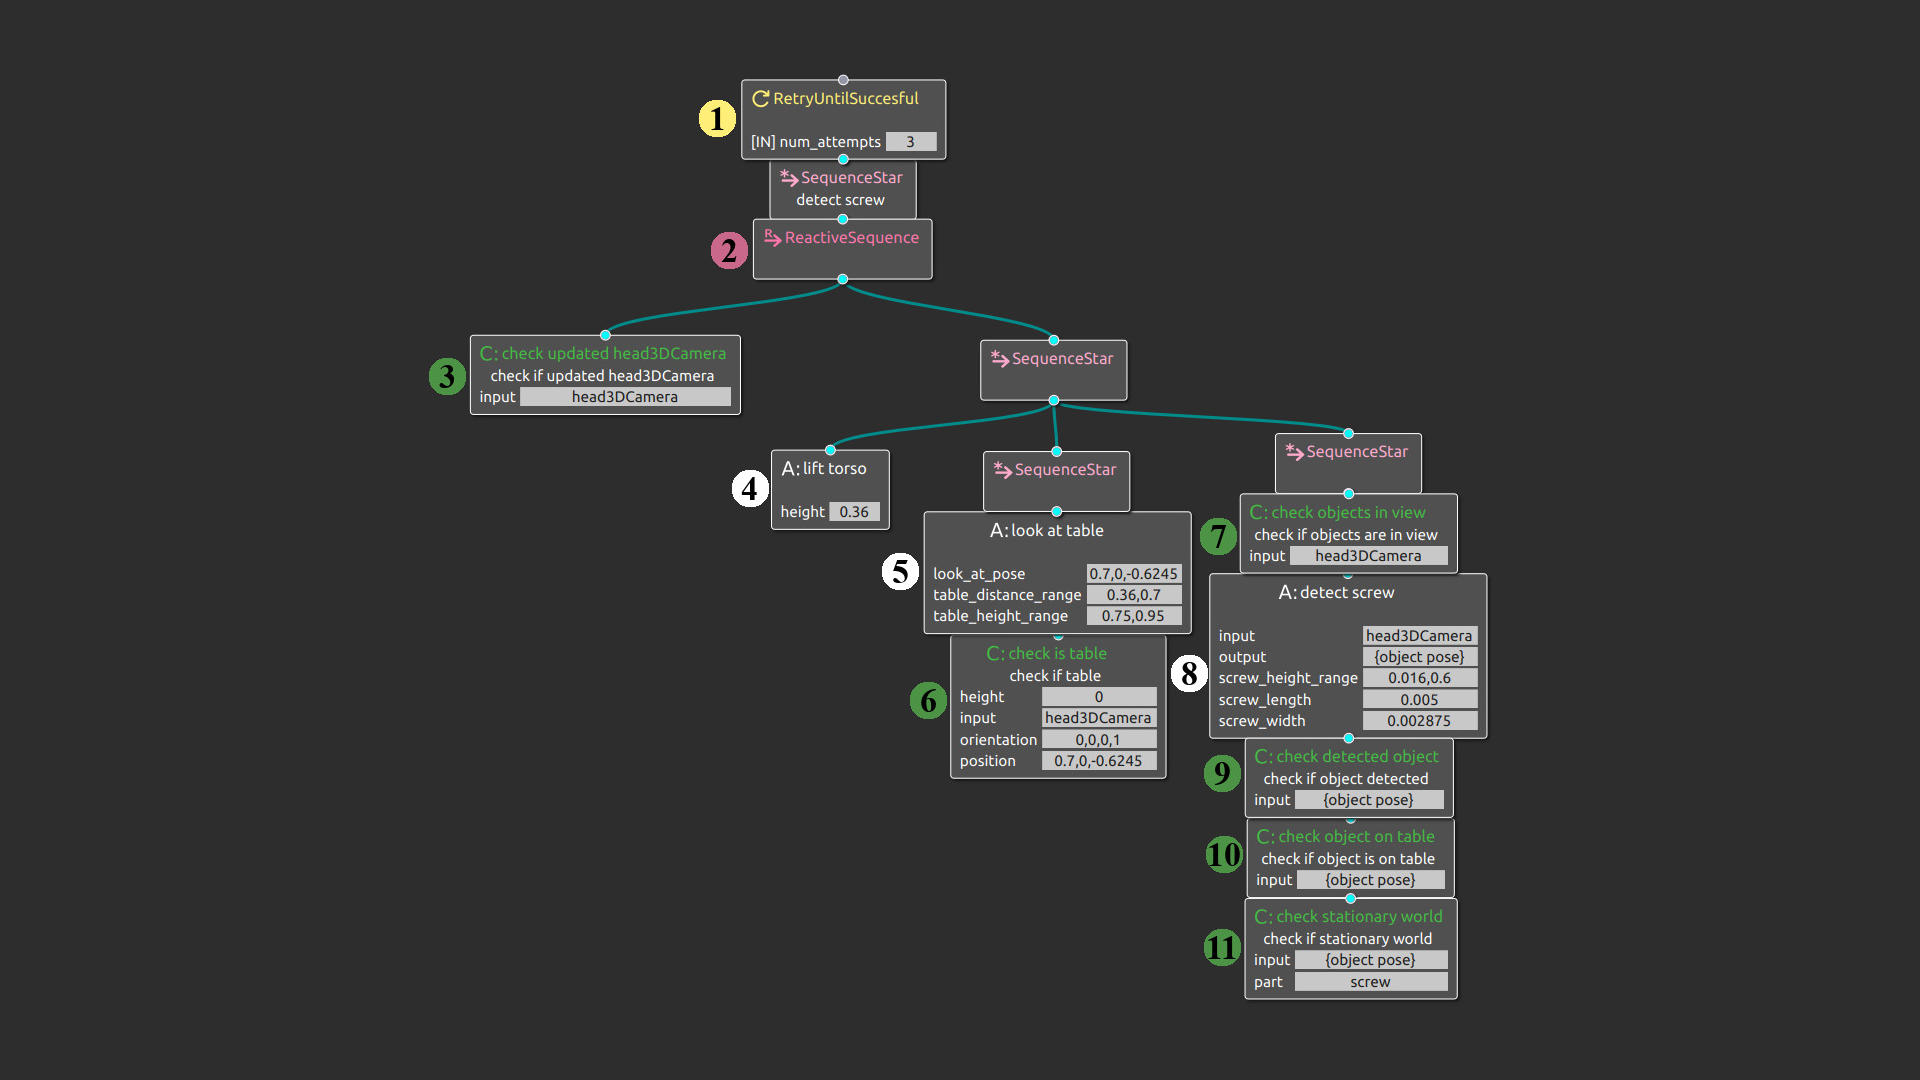
Specifically, we introduced a new Assumption Checker node type and implemented a number of nodes in the behavior tree that represents a mobile manipulation kitting task (see Figure 1). With this system, the robot can identify any violations in the expected system and environment state, and can predictably communicate the cause of an anticipated action failure by actively tracking these violations and ensuring that they hold before executing the action. For example, Figure 1 shows the detect screw subtree of the behavior tree with ACs. While the ACs were manually inserted into the behavior tree in this system, we plan to use machine learning to identify the AC and task relationship in our next iteration.

3 Hypotheses
Proactive Systems can identify and respond to errors earlier than Reactive Systems, as they make decisions based on information, which can then also be used to explain why the robot cannot complete its task. With this extra information, we hypothesize that robots can communicate what went wrong with higher quality explanations, which will result in people having a better understanding of the system and higher ratings of their perception of the system.
In our previously proposed study plans [29], we outlined a set of hypotheses. Since then we have revised our study design, grouped our original hypotheses, and removed H4 Informativeness and H5 Communication Time, as we did not manipulate these metrics.
Hypothesis 1 (Human Perception): The Proactive System will be perceived better than the Reactive System, where human perception is measured by their perceived intelligence and trustworthiness.
This hypothesis combines our original H1 Perceived Intelligence and H2 Trustworthiness as sub-hypotheses to form a single hypothesis regarding the human perception of the system. We hypothesize that the human perception of the Proactive System will be rated higher than the other conditions as we believe that the two sub-hypothesis will be rated higher as described below.
Hypothesis 1a (Perceived Intelligence): We hypothesize that the human perception of the robot’s intelligence will be rated higher for the Proactive System as the Reactive System simply states the failure, while the Proactive explanation shows that the robot system not only has information that it failed, but also has information as to why it failed. We hypothesize that this additional information will result in people perceiving the Proactive System as having a higher level of intelligence.
Hypothesis 1b (Trustworthiness): We also anticipate that the human perception of the robot’s trustworthiness will be higher for the Proactive System as the system is capable of providing more details regarding its failure. Expressing failures [17, 27], providing detailed explanations [18, 44, 45], and proactively explaining behavior [50] have been found to increase the trustworthiness of robot systems, we expect the same to hold for explaining failures.
Hypothesis 2 (Explanation Quality): The Proactive System’s explanations will result in higher explanation quality compared to the Reactive System’s explanations, where explanation quality is defined by understandability and timing of explanations. This hypothesis combines our original h2: Understandability and H6: Temporal Quality to form a single hypothesis regarding the explanation quality of the systems’ explanations.
We hypothesize that the explanation quality of the Proactive System’s explanations will be rated higher than the other conditions as we believe that they will be more understandable and have better timing as described below.
Hypothesis 2a (Understandability): We hypothesize that the Proactive explanations will result in higher understandability compared to the Reactive explanations. This is supported by Malle [31, p. 69], who stated that with causal knowledge and an improved understanding “people can simulate counterfactual as well as future events under a variety of possible circumstances”. Additionally, Das et al. [11] found that explanations consisting of the context of failure and action history enabled non-experts to identify and provide solutions to errors encountered by a robot system.
Hypothesis 2b (Explanation Timing): We believe the timing of explanations will be rated better for the Proactive System as in the Reactive System, the robot does not have any indication that it failed the task until an action node fails. Therefore it cannot communicate the failure as soon as an assumption is violated. Thus, the Reactive System will explain its failure after executing all actions that it can before failing, whereas in the Proactive System, the robot communicates the anomaly and takes the appropriate next action as soon as it notices an assumption violation.
4 Methods
4.1 Participants and Power Analysis
To evaluate our systems, we developed a mixed online user study. To determine our sample size, we ran an a priori power analysis using G*Power 3.1.9.7 [19]: Goodness-of-fit test. The parameters used in this analysis include: Degree of Freedom = 2, a large effect size w of 0.5,  error probability = 0.05, Power (1 –
  error probability) = 0.95. The power analysis determined that we need 62 participants for each of the three conditions, totaling 186 participants. We recruited N = 224 participants through Prolific. Participants were selected from a standard sample across all available countries and pre-screened to be fluent in English and to have a 100% approval rate across more than 100 but fewer than 10,000 prior submissions. We recruited a total of 38 extra participants to account for people who may have failed attention check questions. A total of 37 participants failed attention check questions, and were excluded from our study. The last extra participant was excluded so that we met exactly 186 participants as our power analysis suggested.
Out of the 186 included participants, 128 identified as male, 56 as female, and 2 as non-binary. The participants were aged from 20 to 73 (𝑀 = 34.79,𝑆𝐷 = 10.72). Participants were asked to rate their agreement on a seven point Likert-type item, ranging from “Strongly Disagree” (1) to “Strongly Agree” (7): “I am experienced with robots”; 55 rated higher than neutral agreement (𝑀 = 3.37,𝑆𝐷 = 1.57). This study was approved by the Institutional Review Board of the institution of the first author.
4.2 Scenario and Task

In this study, we used a Fetch mobile manipulator robot [47] with a 7 degree-of-freedom arm and an RGBD camera. The scenario was of a manufacturing company producing kits for gearboxes using a combination of people and newly introduced robots (Figure 2). A worker (the experimenter) sorted gearbox parts and filled up part of a caddy to create a kit of gearbox parts. The robot completed the kit by driving around, picking up, and placing a screw into a caddy.
Participants were tasked with observing the robot to evaluate its performance. To assess the robot’s capability to complete the task and communicate any deviations from expected behavior, the experimenter played the role of a challenger, imitating potential real-world failures by manipulating the environment (e.g., moving the screw bin while the robot was in the process of picking up a screw). In each scenario, the experimenter and robot begin working on their respective tasks in the shared workspace. The robot then provided an explanation when an assumption was violated in the Proactive System, or when a failure occurred in the Reactive System.
4.3 Conditions
The study was a mixed 3 (System Type: Base, Reactive (R), Proactive (P)) × 3 (Failure Type: Screw Bin Empty, Screw Bin Moved, Caddy Out of Reach) design; nine videos of the robot interacting with a person were made reflecting the 9 possible combinations of system type × failure type. Across the three videos watched by an individual participant, they experienced all three explanation and all three failure types, one of each per video; each participant had a randomly assigned configuration. The ordering of the scenarios was counterbalanced to reduce ordering effects. The Fetch robot was running a BT implementation of the task in each system condition with small differences as outlined below. Each system was capable of detecting failures and generating explanations of the failure.
Base (No Explanation): The Base condition utilized the BT to identify when the robot had failed to complete an action. This condition was designed to indicate that a failure had occurred, but did not provide any additional information as the condition served as baseline to compare explanation systems.
Reactive (R): The Reactive condition used the same BT implementation as in the Base. As in the Base condition, this condition only reacted to failures after they had occurred. It differed from the Base as it generated explanations which provided context regarding the robot’s failed subgoal and utilized the action which failed as the reason for failure, similar to the work by Han et al. [24].
Proactive (P): The Proactive System combined the BT implementation in the Base System with ACs. This combination enabled the system to identify when a failure was likely to occur, and enabled the system to generate explanations and react prior to executing an action that would likely fail. This condition could identify why the system would not be able to complete the task using the information provided by the ACs. With this information the system generated an explanation indicating that it was not be able to complete the subgoal due to the reason determined from the ACs.
Table 1: Explanation templates used for each condition.
| Condition | Explanation Template |
| Base | I could not complete my task. |
| Reactive | I could not [failed sub goal node name] because I was not able to [failed action node name]. |
| Proactive | [Assumption checker description] so I will not be able to [failed sub goal node name]. |
To generate explanations, each system used the templates shown in Table 1. The templates for the Reactive and Proactive Systems utilized a subgoal name along with a reason for the failure, which aligns with the suggestions from previous studies on robot explanations [11, 40, 41]. We used templated explanations to enable the system to be robust and generate explanations for various failures, without having to hand-craft explanations for every situation that could occur. As we used templated explanations, the node names inserted into our templates did not always grammatically fit, for example “I could not [pick screw] because I was not able to [detect screw]”. This could potentially be resolved using Natural Language Processing (NLP) frameworks like spaCy [42] to analyze and correct syntax or using generative explanations. We plan to use large language models to compare our templated explanations to generative explanations in future iterations of this system.
4.4 Procedure. Once the participants for our study were selected through Prolific, they were redirected to our Qualtrics survey. Next, each participant filled out an informed consent form and answered a set of demographics questions. To ensure that the audio was enabled and working, each participant was provided an audio clip of a phrase, then required to select the correct phrase from a list before continuing. Participants then reviewed the description of the scenario, robot capabilities, and a labeled image of the arena to understand what was going on in the videos. Next, participants watched three videos according to their randomly assigned condition. At the end of every video, they were asked to respond to a set of questions to assess their experience with the robot. First, the participants were asked a simple attention check question, such as what color was the screw bin, to make sure that the participant was legitimate and paying attention. Then the participants answered a set of end-of-video questions to be discussed in Section 4.5. Finally, after completing all three scenarios, participants were asked to indicate which system they preferred. We estimated that this study would take 30 minutes; the median completion time was 25 minutes. Participants received USD $7.50 at an hourly rate of $15 through Prolific as a compensation for their time and effort.
4.5 Measures
4.5.1 Perceived Intelligence.
To measure the perceived intelligence of each system, we used a modified perceived intelligence scale based on the scale proposed by Warner and Sugarman [46]. This modified version of the scale asks participants to rate their agreement that “The robot was knowledgeable”, “The robot was competent”, “The robot was responsible”, and “The robot was sensible.” Participants responded on 7-point response scaling from “Strongly Disagree” (1) to “Strongly Agree” (7) after each of the three videos that they watched. Internal consistency was measured for each administration of the scale and they ranged from Cronbach’s 𝛼 = 0.82 to 0.88. The responses to each element of the scale were averaged to create a perceived intelligence score.
4.5.2 Trustworthiness
To evaluate the perceived trustworthiness of each system, we asked participants to complete a Muir Trust Scale [34] after watching each of the three videos. This scale measures performance-based trust through four constructs: predictability, reliability, competence, and overall trust. Participants responded on 7-point response scaling from “Strongly Disagree” (1) to “Strongly Agree” (7). Internal consistency was measured for each administration of the scale and they ranged from Cronbach’s 𝛼 = 0.79 to 0.88. The responses to each element of the scale were averaged to create a perceived trustworthiness score.
4.5.3 Understandability
To evaluate the understandability of explanations, we asked a multiple choice question about what participants believed was the cause of failure: “Please select the option that best matches what failures or errors you observed in the video.” Participants were also asked two 7-point responses scaling from “Strongly Disagree” (1) to “Strongly Agree” (7): “The robot’s explanation changed my initial understanding of the robot’s failure” and “The robot’s explanation helped me understand its failure.” This was aimed to evaluate whether the explanation enhanced their understanding as participants could have also used their observations when identifying the cause of failure.
Finally, to gather more insight on the participants’ responses, we asked participants to rate their confidence, from “Very Unsure” (1) to “Very Confident” (7), with their response to the multiple choice item regarding the cause of failure. This question was designed to help us identify if participants guessed regarding the cause of failure, or if they believed that they understood. When designing explanation systems, it is also important that they are clear so that people can confidently identify how to resolve issues rather than leaving it up to guessing. While we did not originally have a hypothesis regarding the participant’s confidence in their responses, we would expect participants’ confidence to be higher in both the Proactive and Reactive conditions as they provide some level of causal information leaving less up for interpretation.
4.5.4 Explanation Timing
Participants were asked to respond to two 7-point responses scaling from “Strongly Disagree” (1) to “Strongly Agree” (7) regarding explanation timing: “When something went wrong, the robot explained so at an appropriate time.” and “The robot should have explained that something went wrong sooner”. These inverses were used to ensure a reliable measure. We report the medians of these two individual questions.
4.5.5 Preference. As a supplemental analysis, we investigated which explanation participants preferred. To do so, we asked the following multiple choice question: “In the three videos that you watched, each had the robot giving a different explanation. Which did you prefer?” The answers that participants could select from consisted of the three different explanations in the same order that they saw them based on their randomly assigned conditions. We also provided a fourth option “Other” which allowed participants to respond in a free response format.
5 Results
5.1 H1 (Human Perception)

5.1.1 H1a (Intelligence). First, since Likert responses are non-parametric data, we performed a Kruskal-Wallis test to assess the statistical significance of intelligence scores among different explanation types, yielding a significant result of (𝜒2(2) = 56.47,𝑝 < 0.0001). Subsequently, post-hoc Dunn tests were conducted with Holm-Bonferroni correction for pairwise comparisons. Notably, we identified significant differences in the comparisons between the P and R conditions (𝑝 < 0.001) and the P and Base conditions (𝑝 < 0.0001). The P condition (𝑀 = 4.55,𝑆𝐷 = 1.21) exhibited higher perceived intelligence scores when compared to both R (𝑀 = 4.12,𝑆𝐷 = 1.25) and the Base condition (𝑀 = 3.57,𝑆𝐷 = 1.28). Furthermore, the R condition displayed significantly higher (𝑝 < 0.001) perceived intelligence scores in comparison to the Base. Means scores for each system condition can be found in Figure 3a.
5.1.2 H1b (Trustworthiness). To evaluate the perceived trustworthiness of the system between each explanation type, we preformed a Kruskall-Wallis test, which was significant (𝜒2(2) = 38.22,𝑝 < 0.0001). To investigate pairwise comparisons we conducted post-hoc Dunn tests with Holm-Bonferroni correction. We found significant differences between the P and R condition (𝑝 = 0.003), P and Base condition (𝑝 < 0.0001), and R and Base condition (𝑝 = 0.003). The P condition (𝑀 = 4.47,𝑆𝐷 = 1.04) was significantly more trustworthy compared to the R (𝑀 = 4.08,𝑆𝐷 = 1.18) and Base (𝑀 = 3.66,𝑆𝐷 = 1.25) conditions. The R condition also was significantly more trustworthy compared to the base condition. Means scores for each system condition can be found in Figure 3b.
5.2 H2 (Explanation Quality)
5.2.1 H2a (Understandability). To examine understandability, we evaluated the multiple choice question on the cause of failure. A distribution of the responses can be seen in the confusion matrix in Figure 4. First, we performed chi-squared goodness of fit tests and found that the distribution of our responses were not equivalent to random choice (𝑝 < 0.0001) for each condition. For each failure condition we then ran Fisher’s exact test for count data and found a significant relationship in all three failure conditions, Screw Bin Empty: (𝑝 < 0.0001), Screw Bin Moved: (𝑝 < 0.0001), Caddy Out Of Reach: (𝑝 < 0.0001). With these significant relationships, we then followed up with post-hoc pairwise nominal independence tests using Fisher’s exact test and false discovery rate correction to analyze the pairwise relationships within each failure condition.

After investigating these pairwise relationships, we wanted to further investigate commonly chosen incorrect responses to understand how participants misunderstood the cause of the robot’s failure between system type conditions. To do so we created a confusion matrix for each failure condition (See Figure 4).
For the Screw Bin Empty scenario, we found significant differences between the Base and R conditions (𝑝 < 0.0001), Base and P condition (𝑝 < 0.0001), and the R and P conditions (𝑝 = 0.0134). As highlighted in blue in the first column of Figure 4, the true cause of the failure was “There were no screws in the bin on the table”. In the Base condition, the most selected answer was “Not Sure” at 25.81% followed by 24.19% with the correct cause of failure. In the R condition, the most selected answer was “The robot could not detect the screws that were in the screw bin” at 52.46%, then 37.70% with the correct response. In the P condition, 63.49% of responses were correct, and the most confused answer was “The robot could not detect the screws that were in the screw bin” at 26.98%.
As we see from the responses, a popular incorrect choice (Base: 4.84%; R: 52.46%, P: 26.98%) was “The robot could not detect the screws that were in the screw bin”. This response shows that the participants partially understood the cause of failure. Only in the P condition did the correct response receive the most number of selections, showing that for this failure type people understood this explanation type more than the others.
In the Screw Bin Moved scenario, we found significant differences between the Base and P conditions (𝑝 < 0.0001) and the R and P conditions (𝑝 < 0.001), but there was not a significant difference between the R and Base conditions in this scenario. The confusion matrix for this condition can be seen in Figure 4 mid-right.
In this failure condition, the most selected response for every explanation type was correct, “The screw bin was moved while the robot was looking for screws”. In the Base condition, 59.38% chose the correct response, the second most common selection was “The robot could not detect the caddy that was on the table” at 12.5%. For the R condition, 57.14% of participants selected the correct response, with 11.11% selecting “The robot could not reach the screws because they were too far away.” In the P condition, 72.88% of participants chose the correct response, with a tie for second at 8.47% selecting “The robot could not detect the screws that were in the screw bin” and “The caddy was moved while the robot was looking for it”.
As noted earlier, there were not significant differences between the Base and R conditions, but we found significant differences between the P and both the Base and R conditions. More people in the P condition selected the correct response showing that, for this failure type, people understood the P explanation type more.
In the Caddy Out Of Reach scenario, significant differences were observed between the Base and P conditions (𝑝 < 0.0001), the R and P conditions (𝑝 < 0.001), and the Base and R conditions (𝑝 = 0.0476). The confusion matrix is shown in Figure 4. The true cause of failure in this condition was “The robot could not place a screw in the caddy because the caddy was too far away”.
In the Base condition, 40% chose “The robot could not detect the caddy that was on the table” as the most selected response, with only 33.33% selecting the correct response. In the R condition, 38.71% chose the correct response, while 24.19% selected “The robot could not detect the caddy that was on the table”. In contrast, the P condition showed the highest understanding, with 81.25% selecting the correct response and only 9.38% choosing “The robot could not detect the caddy that was on the table”. Notably, the most common incorrect response was “The robot could not detect the caddy that was on the table”. Those who selected this response recognized that the caddy was involved in the failure but did not grasp that though the robot had detected the caddy, it couldn’t reach it. The distribution of responses shows that a larger proportion in the P condition answered correctly, reinforcing the better understanding of the P explanation type over the others for this type of failure.

Influence on Understanding: Participants’ understanding of the cause of the robot’s failure may be influenced by visual observations. For example, a participant could potentially observe that the caddy was out of the robot’s reach while observing the robot. To isolate the impact that the explanation had on their understanding we first analyze the responses to “The robot’s explanation changed my initial understanding of the robot’s failure.” First, we performed a Kruskall-Wallis test, which revealed a statistical significance (𝜒2(2) = 135.13,𝑝 < 0.0001). Next, we investigated pairwise comparisons by conducting post-hoc Dunn tests with Holm-Bonferroni correction. There were significant differences between the Base and R conditions (𝑝 < 0.0001), Base and P condition (𝑝 < 0.0001), and the R and P (𝑝 = 0.0015) conditions. A distribution of responses to this question can be seen in Figure 5a. The P condition resulted in the largest influence on understanding (𝑀 = 4.53,𝑆𝐷 = 1.82,𝑀𝑑𝑛 = 5), followed by R (𝑀 = 3.87,𝑆𝐷 = 1.80,𝑀𝑑𝑛 = 4), and Base (𝑀 = 2.28,𝑆𝐷 = 1.45,𝑀𝑑𝑛 = 2).
While we strive for explanations to have a positive influence on a person’s understanding, they may also have a negative influence if they are confusing. To further investigate the direction of the influence, we analyze the responses to the question “The robot’s explanation helped me understand its failure.” To evaluate this we first performed a Kruskall-Wallis test (𝜒2(2) = 236.95,𝑝 < 0.0001) and followed it up with post-hoc Dunn tests with Holm-Bonferroni correction for pairwise comparisons. There were significant differences between the Base and R conditions (𝑝 < 0.0001), Base and P condition (𝑝 < 0.0001), and the R and P (𝑝 < 0.0001) conditions. The explanation condition that was rated as the most helpful was the P condition (𝑀 = 5.91,𝑆𝐷 = 1.12,𝑀𝑑𝑛 = 6), followed by R (𝑀 = 4.85,𝑆𝐷 = 1.77,𝑀𝑑𝑛 = 5), and Base (𝑀 = 2.41,𝑆𝐷 = 1.76,𝑀𝑑𝑛 = 2). A distribution of responses to this question is in Figure 5b.
Ultimately, participants rated that the P explanation condition helped them understand the failure better, and also caused the largest change in their understanding of the robot’s failure.
Confidence: To measure the participants’ confidence in their selection of the cause of failure, we first performed a Kruskall-Wallis test, revealing a statistical significance (𝜒2(2) = 23.28,𝑝 < 0.0001). Then we investigate pairwise comparisons by conducting post-hoc Dunn tests with Holm-Bonferroni correction. There were significant differences between the Base and R conditions (𝑝 = 0.011), Base and P condition (𝑝 < 0.0001), and the R and P (𝑝 = 0.041) conditions. The P condition resulted in the most confidence (𝑀 = 6.00,𝑆𝐷 = 1.12,𝑀𝑑𝑛 = 6), R resulted in the second most confidence (𝑀 = 5.72,𝑆𝐷 = 1.31,𝑀𝑑𝑛 = 6), and finally the Base condition resulted in the lowest confidence (𝑀 = 5.21,𝑆𝐷 = 1.68,𝑀𝑑𝑛 = 6). Figure 5c shows the distribution of responses to this question.
5.2.2 H2b (Explanation Timing)
The participants’ perceptions of the timing of the explanations were measured using two questions. We first analyzed the responses to the question “When something went wrong, the robot explained so at an appropriate time.” We first performed a Kruskall-Wallis test, revealing a statistical significance (𝜒2(2) = 89.71,𝑝 < 0.0001), and conducted post-hoc Dunn tests with Holm-Bonferroni correction. We found significant differences between the P and R conditions (𝑝 < 0.0001), P and Base conditions (𝑝 < 0.0001), and R and Base conditions (𝑝 = 0.0048). The P condition (𝑀 = 5.52,𝑆𝐷 = 1.41,𝑀𝑑𝑛 = 6) had significantly higher ratings compared to the R (𝑀 = 4.35,𝑆𝐷 = 1.71,𝑀𝑑𝑛 = 5) and Base (𝑀 = 3.76,𝑆𝐷 = 1.87,𝑀𝑑𝑛 = 4) conditions. The R condition also had significantly higher ratings compared to the Base condition. A distribution of the responses can be seen in Figure 5d. We then investigated the second question “The robot should have explained that something went wrong sooner”. We performed a Kruskall-Wallis test, revealing a statistical significance (𝜒2(2) = 41.409,𝑝 < 0.0001) and post-hoc Dunn tests with Holm-Bonferroni correction to test for pairwise comparisons. There were significant differences between the P and R conditions (𝑝 < 0.0001) and between P and Base condition (𝑝 < 0.0001). The differences between R and Base for this question were not significant. The P condition (𝑀 = 3.741,𝑆𝐷 = 1.89,𝑀𝑑𝑛 = 4) had significantly lower ratings, where lower is better, compared to the R (𝑀 = 4.91,𝑆𝐷 = 1.76,𝑀𝑑𝑛 = 5) and Base (𝑀 = 4.71,𝑆𝐷 = 1.65,𝑀𝑑𝑛 = 5) condition. Figure 5e shows the distribution of responses to this question.
Ultimately, participants rated that the Proactive condition had better timing compared to the Reactive and Base conditions.
5.3 Preference. To evaluate the participants’ preference between the explanation types, we first performed a Chi-Square analysis 𝑋2(3,𝑁 = 186) = 213.74,𝑝 < 0.0001). We then followed this up with a pairwise binomial test with Holm-Bonferroni correction to test the pairwise comparisons. There were significant differences between the Base and R conditions (𝑝 < 0.0001), Base and P condition (𝑝 < 0.0001), and the R and P (𝑝 < 0.0001). The most preferred explanation type was P (𝑁 = 127), followed by R (𝑁 = 49), and lastly the Base condition (𝑁 = 7). A total of 3 participants selected “Other”. Two of these participants indicated that they preferred a mix between the R and P condition. The third stated that they “would prefer an explanation that sounded gramatically [sic] correct”.
6 Discussions and Conclusion
In our online study, we evaluated a Proactive and Reactive error explanation system. Based on our results, we propose the following recommendations and opportunities for future work.
6.1 Improving System Adoption
Increasing system adoption is essential to effectively utilize robots in a shared workspace, such as a manufacturing line. Increased adoption of robots has been attributed to higher perceived intelligence and trust [33]. Trust has also been found to influence reliance [28] and increase use [35] of robots. Proactive Systems were seen as more intelligent (Section 5.1.1) and trustworthy (Section 5.1.2), therefore, we recommend that Proactive Systems be used to increase adoption.
6.2 Diagnosing Failures
As more robot systems are deployed in manufacturing, personal assistance, delivery, stores, and other aspects of our daily life, expert technicians will likely not be around to supervise a robot all day. Thus, people who may not have much experience with robots may encounter these systems when they need assistance. Providing clear explanations enables novices to better understand and diagnose robot failures [11]. Our Proactive System’s explanations, which communicated why the robot likely would not be able to complete its task, were more understandable (Section 5.2.1) than our Reactive System’s, which communicated what failed, but not why it failed. The Proactive System’s explanations had a larger impact on participants’ overall understanding of the robot’s failure and led to higher levels of confidence in their understanding. Participants also preferred the explanations from our Proactive Systems (Section 5.3). Therefore we recommend that systems are designed to identify and communicate reasons why they fail when something goes wrong, improving people’s ability to confidently diagnose the failure.
6.3 Trade-offs for Timely Explanations
Timing of explanations is important when diagnosing robot failures. Participants ultimately preferred the earlier explanations from the Proactive System (Section 5.2.2). Participants’ responses to the timing questions for the Reactive and Base explanations were not expected to be different as they generate explanations at the same time. Surprisingly, we observed significant differences in the appropriateness of the explanation timing between the Reactive and Base conditions in response to the first question: “When something went wrong, the robot explained so at an appropriate time”. One participant’s explanation for their response in the Base condition offers insight as to why this might be: “It took it quite a while of standing still to inform us that it wasn’t able to complete its task without giving any explanation”. This suggests that people might anticipate low detail responses to be quicker compared to more detailed ones. This trade-off between the level of information provided by a robot and the timing of response warrants further investigation in future work.
Several participants noted another trade-off between explanation timing and the robot’s need to troubleshoot prior to asking for help, which is summarized nicely by one participant’s response referring to the Proactive System: “While there was a lag, I think it makes sense if the robot is trying to troubleshoot or recalibrate for itself to see if there’s a way to complete their mission before reporting”. This trade-off may also be influenced by the length or quality of explanations, as discussed above and remains an open discussion that should be further investigated in future work.
6.4 Applications to Other Domains
While we evaluated our systems using an assembly line scenario, several other subfields could benefit from Proactive Systems. Human-in-the-loop robot teleoperation can benefit from the robot being able to predict when an operator’s commands would likely not succeed and then explain why to an operator, improving the team’s overall efficiency. Explanations can also potentially improve the operator’s understanding of the robot’s limitations, a barrier for novice user teleoperation [37].
Social robots could also benefit. When social robots fail, a person’s trust in the system often degrades [23, 39], however, systems can justify their failure to compensate for this loss of trust when consequences are not severe [9]. Thus, by deploying social robots with Proactive error detection and explanation systems, we would expect systems to similarly maintain their trust levels during low consequence failures. Additionally, the robot would be capable of preemptively attempting to get help or resolving issues before it fails, resulting in more timely explanations as we saw in our study.
Acknowledgments This work has been supported in part by the Office of Naval Research (N00014-18-1-2503).
References
[1] 2019. FetchIt! A Mobile Manipulation Challenge. https://opensource.fetchrobotics.com/competition. Accessed: 2022-02-04.
[2] Amina Adadi and Mohammed Berrada. 2018. Peeking Inside the Black-Box: A Survey on Explainable Artificial Intelligence (XAI). IEEE Access 6 (2018), 52138–52160.
[3] Aneseh Alvanpour, Sumit Kumar Das, Christopher Kevin Robinson, Olfa Nasraoui, and Dan Popa. 2020. Robot Failure Mode Prediction with Explainable Machine Learning. In 2020 IEEE 16th International Conference on Automation Science and Engineering (CASE). IEEE, 61–66.
[4] Gordon Michael Briggs and Matthias Scheutz. 2015. “Sorry, I Can’t Do That”: Developing Mechanisms to Appropriately Reject Directives in Human-Robot Interactions. In 2015 AAAI Fall Symposium Series.
[5] Erik Cambria, Lorenzo Malandri, Fabio Mercorio, Mario Mezzanzanica, and Navid Nobani. 2023. A survey on XAI and natural language explanations. Information Processing & Management 60, 1 (2023), 103111.
[6] Xuan Cao, Alvika Gautam, Tim Whiting, Skyler Smith, Michael A. Goodrich, and Jacob W. Crandall. 2023. Robot Proficiency Self-Assessment Using Assumption-Alignment Tracking. IEEE Transactions on Robotics 39, 4 (2023), 3279–3298.
[7] Michele Colledanchise and Petter Ögren. 2018. Behavior Trees in Robotics and AI: An Introduction. CRC Press.
[8] Michele Colledanchise, Ramviyas Parasuraman, and Petter Ögren. 2018. Learning of Behavior Trees for Autonomous Agents. IEEE Transactions on Games 11, 2 (2018), 183–189.
[9] Filipa Correia, Carla Guerra, Samuel Mascarenhas, Francisco S Melo, and Ana Paiva. 2018. Exploring the Impact of Fault Justification in Human-Robot Trust. In Proceedings of the 17th International Conference on Autonomous Agents and Multiagent Systems. 507–513.
[10] Arun Das and Paul Rad. 2020. Opportunities and Challenges in Explainable Artificial Intelligence (XAI): A Survey. arXiv preprint arXiv:2006.11371 (2020).
[11] Devleena Das, Siddhartha Banerjee, and Sonia Chernova. 2021. Explainable AI for Robot Failures: Generating Explanations that Improve User Assistance in Fault Recovery. In Proceedings of the 2021 ACM/IEEE International Conference on Human-Robot Interaction. 351–360.
[12] Devleena Das and Sonia Chernova. 2021. Semantic-Based Explainable AI: Leveraging Semantic Scene Graphs and Pairwise Ranking to Explain Robot Failures. In 2021 IEEE/RSJ International Conference on Intelligent Robots and Systems (IROS). IEEE, 3034–3041.
[13] Maximilian Diehl and Karinne Ramirez-Amaro. 2022. Why Did I Fail? A Causal-Based Method to Find Explanations for Robot Failures. IEEE Robotics and Automation Letters 7, 4 (2022), 8925–8932.
[14] Maximilian Diehl and Karinne Ramirez-Amaro. 2023. A causal-based approach to explain, predict and prevent failures in robotic tasks. Robotics and Autonomous Systems 162 (2023), 104376.
[15] Filip Karlo Došilović, Mario Brčić, and Nikica Hlupić. 2018. Explainable Artificial Intelligence: A Survey. In 2018 41st International Convention on Information and Communication Technology, Electronics and Microelectronics (MIPRO). IEEE, 0210–0215.
[16] Rudresh Dwivedi, Devam Dave, Het Naik, Smiti Singhal, Rana Omer, Pankesh Patel, Bin Qian, Zhenyu Wen, Tejal Shah, Graham Morgan, et al. 2023. Explainable AI (XAI): Core Ideas, Techniques, and Solutions. Comput. Surveys 55, 9 (2023), 1–33.
[17] Mary T Dzindolet, Scott A Peterson, Regina A Pomranky, Linda G Pierce, and Hall P Beck. 2003. The role of trust in automation reliance. International Journal of Human-Computer Studies 58, 6 (2003), 697–718.
[18] Mark Edmonds, Feng Gao, Hangxin Liu, Xu Xie, Siyuan Qi, Brandon Rothrock, Yixin Zhu, Ying Nian Wu, Hongjing Lu, and Song-Chun Zhu. 2019. A tale of two explanations: Enhancing human trust by explaining robot behavior. Science Robotics 4, 37 (2019).
[19] Franz Faul, Edgar Erdfelder, Axel Buchner, and Albert-Georg Lang. 2009. Statistical power analyses using G* Power 3.1: Tests for correlation and regression analyses. Behavior Research Methods 41, 4 (2009), 1149–1160.
[20] Luke S. Fletcher, Seth Teller, Edwin. B. Olson, David C. Moore, Yoshiaki Kuwata, Jonathan P. How, John J. Leonard, Isaac Miller, Mark. Campbell, Dan Huttenlocher, Aaron Nathan, and Frank-Robert Kline. 2009. The MIT – Cornell Collision and Why It Happened. Springer Berlin Heidelberg, Berlin, Heidelberg, 509–548.
[21] Alvika Gautam, Tim Whiting, Xuan Cao, Michael A. Goodrich, and Jacob W. Crandall. 2022. A Method for Designing Autonomous Agents that Know Their Limits. In IEEE International Conference on Robotics and Automation (ICRA).
[22] Konstantinos Gavriilidis, Andrea Munafo, Wei Pang, and Helen Hastie. 2023. A Surrogate Model Framework for Explainable Autonomous Behaviour. arXiv preprint arXiv:2305.19724 (2023).
[23] Ioanna Giorgi, Francesca Ausilia Tirotto, Oksana Hagen, Farida Aider, Mario Gianni, Marco Palomino, and Giovanni L Masala. 2022. Friendly But Faulty: A Pilot Study on the Perceived Trust of Older Adults in a Social Robot. IEEE Access 10 (2022), 92084–92096.
[24] Zhao Han, Daniel Giger, Jordan Allspaw, Michael S Lee, Henny Admoni, and Holly A Yanco. 2021. Building The Foundation of Robot Explanation Generation Using Behavior Trees. ACM Transactions on Human-Robot Interaction (THRI) 10, 3 (2021), 1–31.
[25] Zhao Han, Elizabeth Phillips, and Holly A Yanco. 2021. The Need for Verbal Robot Explanations and How People Would Like a Robot to Explain Itself. ACM Transactions on Human-Robot Interaction (THRI) 10, 4 (2021), 1–42.
[26] Zhao Han and Holly Yanco. 2023. Communicating Missing Causal Information to Explain a Robot’s Past Behavior. ACM Transactions on Human-Robot Interaction 12, 1 (2023), 1–45.
[27] Minae Kwon, Sandy H Huang, and Anca D Dragan. 2018. Expressing Robot Incapability. In Proceedings of the 2018 ACM/IEEE International Conference on Human-Robot Interaction. 87–95.
[28] John D Lee and Katrina A See. 2004. Trust in Automation: Designing for Appropriate Reliance. Human factors 46, 1 (2004), 50–80.
[29] Gregory LeMasurier, Alvika Gautam, Zhao Han, Jacob W Crandall, and Holly A Yanco. 2022. “Why Didn’t I Do It?” A Study Design to Evaluate Robot Explanations. In HRI 2022 Workshop YOUR study design! Participatory critique and refinement of participants’ studies.
[30] Zeyi Liu, Arpit Bahety, and Shuran Song. 2023. REFLECT: Summarizing Robot Experiences for FaiLure Explanation and CorrecTion. 7th Conference on Robot Learning (CoRL 2023) (2023).
[31] Bertram F Malle. 2006. How the Mind Explains Behavior: Folk Explanations, Meaning, and Social Interaction. MIT Press.
[32] Dang Minh, H Xiang Wang, Y Fen Li, and Tan N Nguyen. 2022. Explainable artificial intelligence: a comprehensive review. Artificial Intelligence Review (2022), 1–66.
[33] Sara Moussawi, Marios Koufaris, and Raquel Benbunan-Fich. 2021. How perceptions of intelligence and anthropomorphism affect adoption of personal intelligent agents. Electronic Markets 31 (2021), 343–364.
[34] Bonnie Marlene Muir. 1989. Operators’ Trust in and Use of Automatic Controllers in a Supervisory Process Control Task. (1989).
[35] Raja Parasuraman and Victor Riley. 1997. Humans and Automation: Use, Misuse, Disuse, Abuse. Human factors 39, 2 (1997), 230–253.
[36] Vasumathi Raman, Constantine Lignos, Cameron Finucane, Kenton CT Lee, Mitchell P Marcus, and Hadas Kress-Gazit. 2013. Sorry Dave, I’m Afraid I Can’t Do That: Explaining Unachievable Robot Tasks Using Natural Language. In Robotics: Science and Systems, Vol. 2. Citeseer, 2–1.
[37] Daniel J Rea and Stela H Seo. 2022. Still Not Solved: A Call for Renewed Focus on User-Centered Teleoperation Interfaces. Frontiers in Robotics and AI 9 (2022).
[38] Mireia Ribera and Àgata Lapedriza García. 2019. Can we do better explanations? A proposal of User-Centered Explainable AI. CEUR Workshop Proceedings.
[39] Eileen Roesler, Linda Onnasch, and Julia I Majer. 2020. The Effect of Anthropomorphism and Failure Comprehensibility on Human-Robot Trust. In Proceedings of the Human Factors and Ergonomics Society Annual Meeting, Vol. 64. SAGE Publications Sage CA: Los Angeles, CA, 107–111.
[40] Sonja Stange and Stefan Kopp. 2020. Effects of a Social Robot’s Self-Explanations on How Humans Understand and Evaluate Its Behavior. In Proceedings of the 2020 ACM/IEEE International Conference on Human-Robot Interaction. 619–627.
[41] Ravenna Thielstrom, Antonio Roque, Meia Chita-Tegmark, and Matthias Scheutz. 2020. Generating Explanations of Action Failures in a Cognitive Robotic Architecture. In 2nd Workshop on Interactive Natural Language Technology for Explainable Artificial Intelligence. 67–72.
[42] Yuli Vasiliev. 2020. Natural Language Processing with Python and spaCy: A Practical Introduction. No Starch Press.
[43] Giulia Vilone and Luca Longo. 2021. Classification of Explainable Artificial Intelligence Methods through Their Output Formats. Machine Learning and Knowledge Extraction 3, 3 (2021), 615–661.
[44] Ning Wang, David V Pynadath, and Susan G Hill. 2016. Trust Calibration within a Human-Robot Team: Comparing Automatically Generated Explanations. In 2016 11th ACM/IEEE International Conference on Human-Robot Interaction (HRI). IEEE, 109–116.
[45] Ning Wang, David V Pynadath, Ericka Rovira, Michael J Barnes, and Susan G Hill. 2018. Is It My Looks? Or Something I Said? The Impact of Explanations, Embodiment, and Expectations on Trust and Performance in Human-Robot Teams. In International Conference on Persuasive Technology. Springer, 56–69.
[46] Rebecca M Warner and David B Sugarman. 1986. Attributions of Personality Based on Physical Appearance, Speech, and Handwriting. Journal of Personality and Social Psychology 50, 4 (1986), 792.
[47] Melonee Wise, Michael Ferguson, Derek King, Eric Diehr, and David Dymesich. 2016. Fetch & Freight: Standard Platforms for Service Robot Applications. In Workshop on Autonomous Mobile Service Robots.
[48] Qi Zhang, Jian Yao, Quanjun Yin, and Yabing Zha. 2018. Learning Behavior Trees for Autonomous Agents with Hybrid Constraints Evolution. Applied Sciences 8, 7 (2018), 1077.
[49] Yuanhai Zhou, Shiqiang Zhu, Wei Song, Jianjun Gu, Jie Ren, Xiangming Xi, Tianlei Jin, and Zonghao Mu. 2022. Robot Planning based on Behavior Tree and Knowledge Graph. In 2022 IEEE International Conference on Robotics and Biomimetics (ROBIO). IEEE, 827–832.
[50] Lixiao Zhu and Thomas Williams. 2020. Effects of Proactive Explanations by Robots on Human-Robot Trust. In Social Robotics: 12th International Conference, ICSR 2020, Golden, CO, USA, November 14–18, 2020, Proceedings 12. Springer, 85–95.
[51] Sebastián Zudaire, Felipe Gorostiaga, César Sánchez, Gerardo Schneider, and Sebastián Uchitel. 2021. Assumption Monitoring Using Runtime Verification for UAV Temporal Task Plan Executions. In 2021 IEEE International Conference on Robotics and Automation (ICRA). IEEE, 6824–6830.